There comes a special moment in everyone's life, when they feel a sudden urge to migrate from one cloud provider to another. And our team wasn't an exception! A couple of months ago we started the migration from GCP to AWS. The process took us more than a couple of hours, and after solving several minor breaks, we were doing the post-migration checks. The average load was fastly approaching normal when we discovered that our services leak memory.
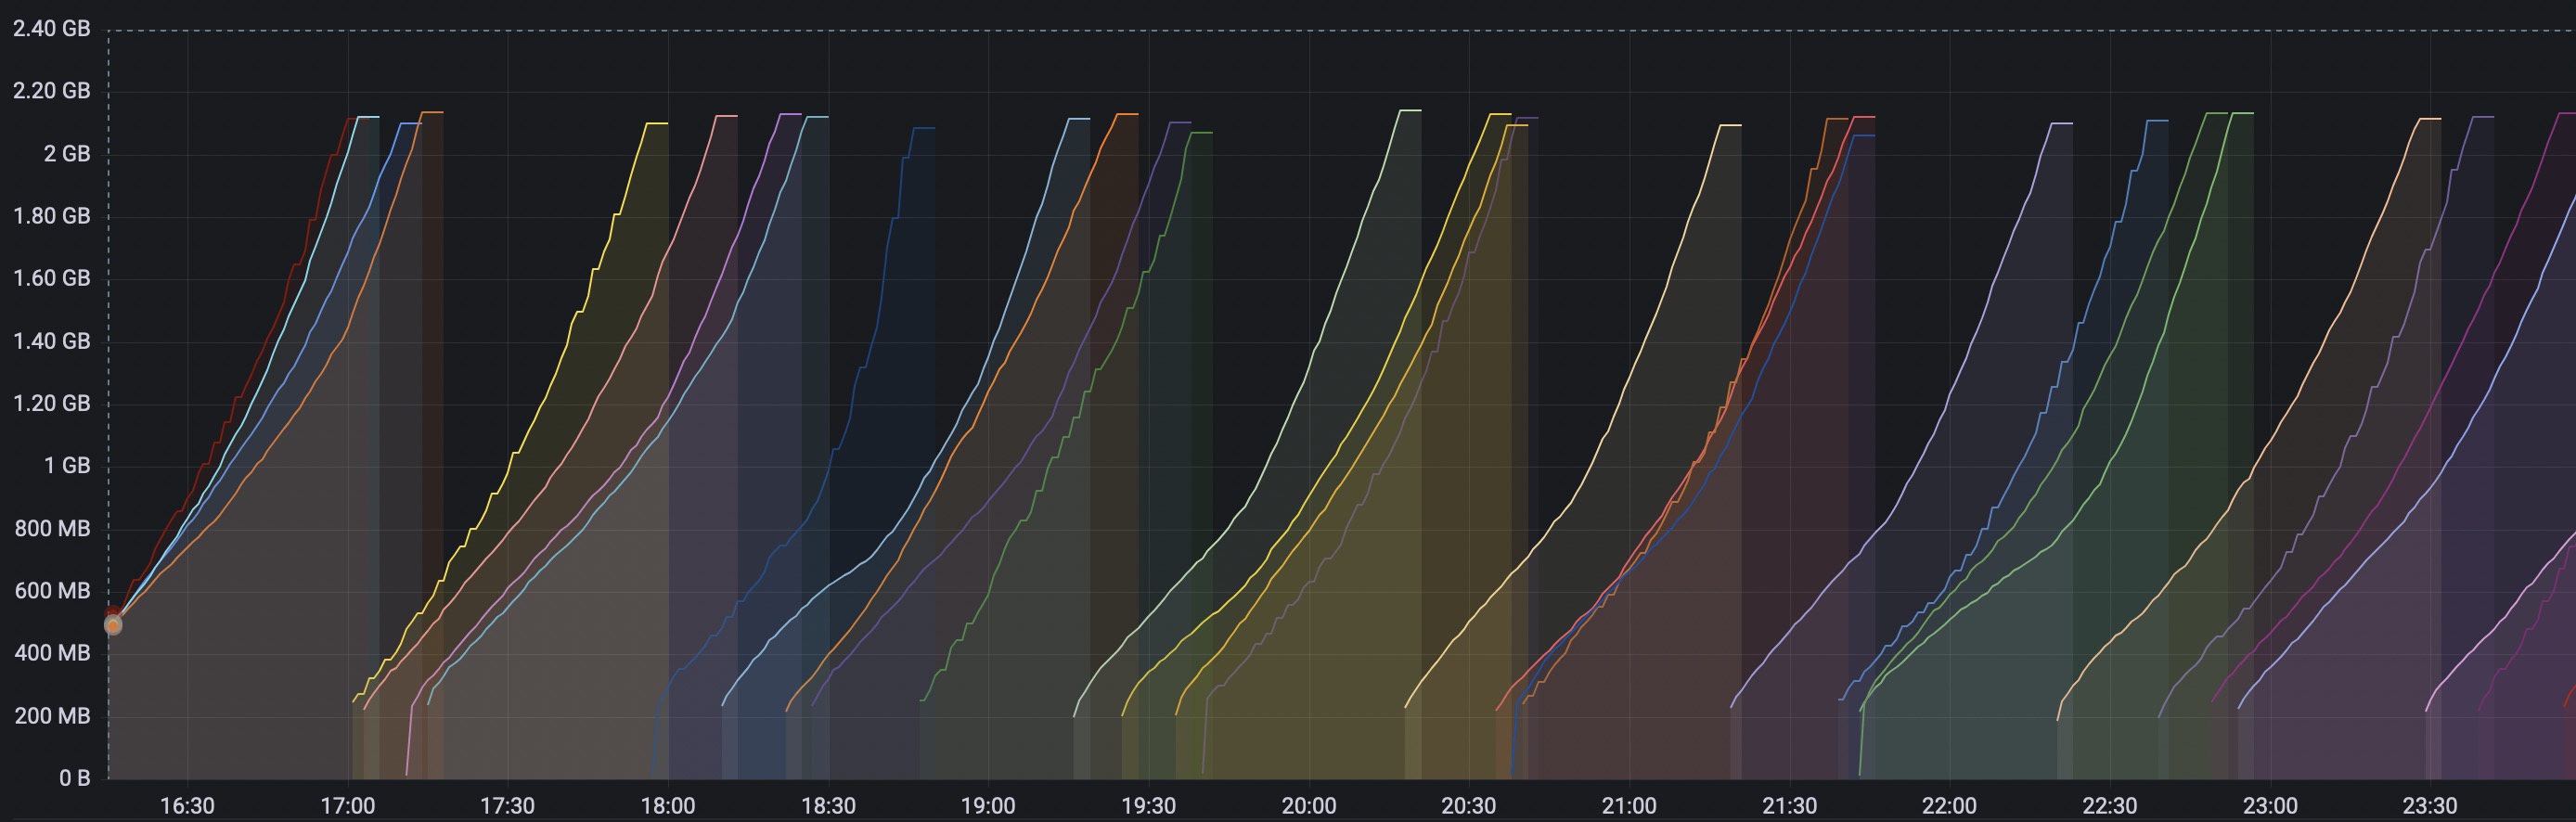
Saw-like spikes of mem.usage, very sharp, don't cut yourself!
This wasn't something urgent, as all our services were functioning normally (except that they had to restart every N minutes, and the less memory we had dedicated to a service, the more often they were restarting). But it was unexpected, and unpleasant, less to say.
The first thought was Uhhh, excuse us, AWS, are you trying to trick us with... whatever stuff you have there at your disposal?. That was a sweet thought as it'd mean delegating the problem and caring much less about it. But before rushing to AWS support we did a couple of checks if it can possibly be that some of our internal changes caused this. Unfortunately, that wasn't the case. We had all the latest versions built and deployed to our old production, then we did stop-the-world and after the database migration was done we deployed absolutely the same versions of our services. So in regards to the architecture, versions and data, everything was (or should've been) the same.
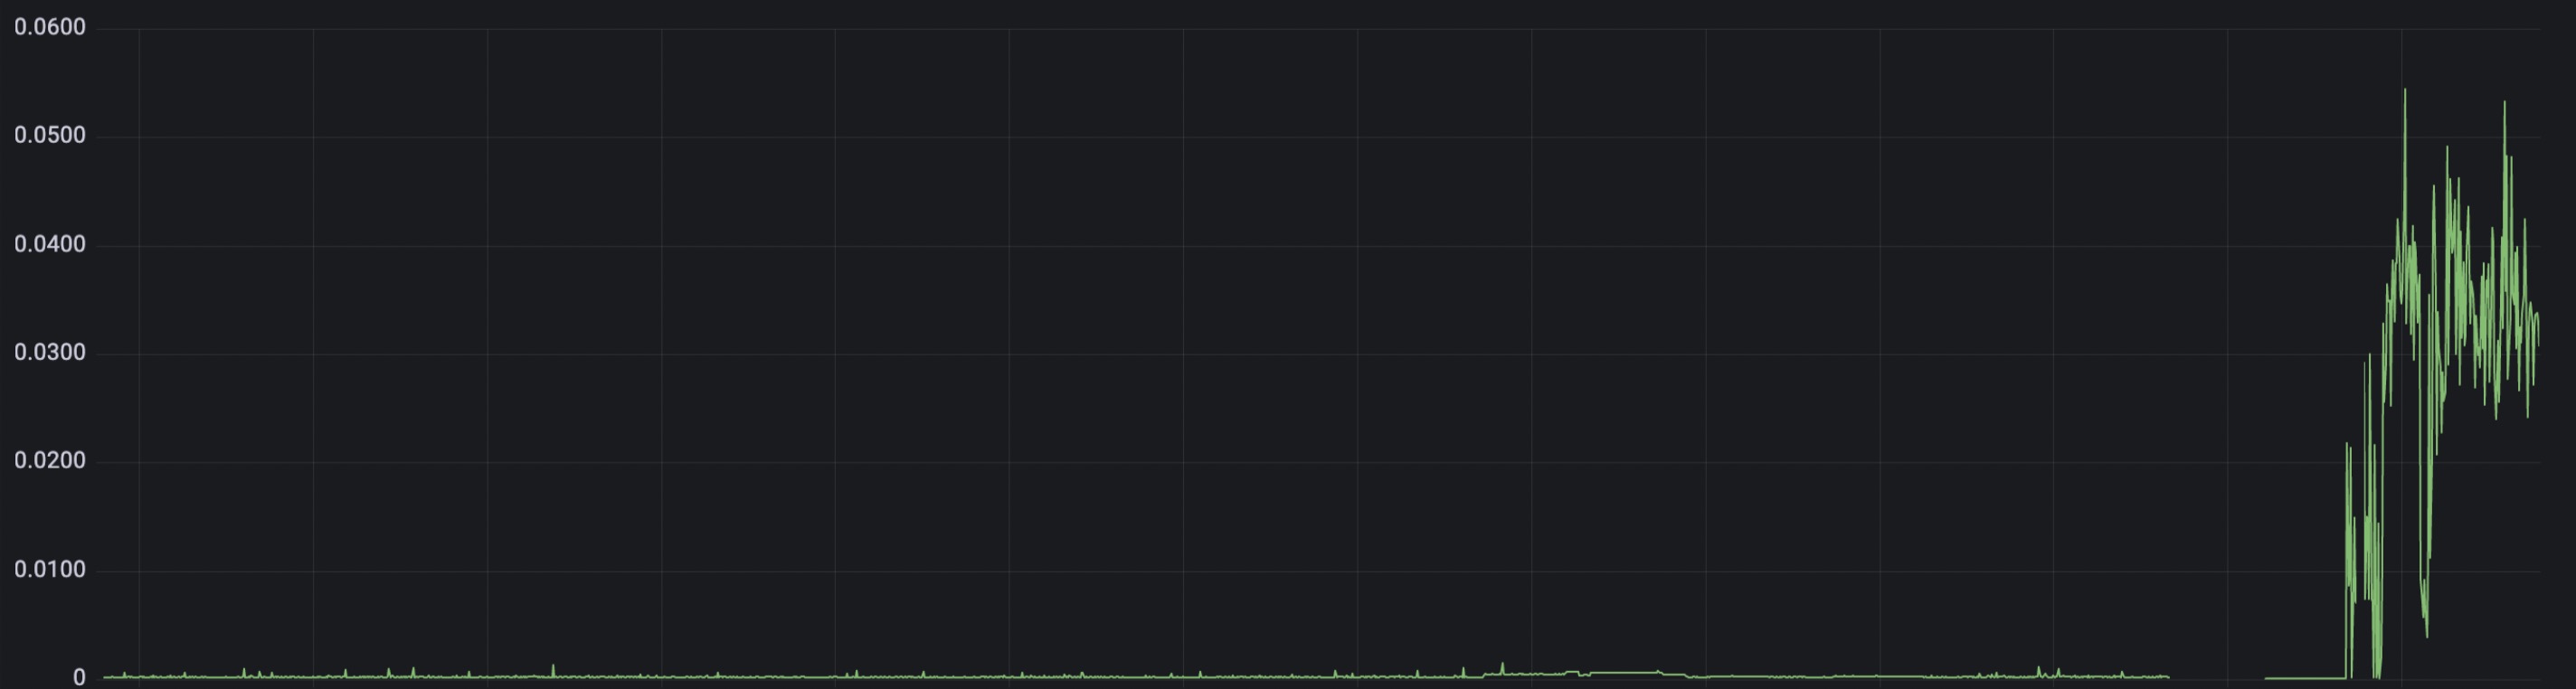
The graph of GC duration jumped up like crazy
The obvious entrypoint to this issue, or the one that many people would probably start from, was to profile the services and see who brought the disorder to our previously peaceful world. So we started with profiling and... there was nothing. Well, not exactly nothing, but heap profile showed that we had only a couple of megs data at most(!). For me it was a bolt of the blue, I definitely did not expect to see ~0 memory consumption. RSS of the process was reporting about Gigabytes of used memory, and I was not ready to believe in that 8MiB nonsense. We started generating ideas what could possibly happen:
What if it's not the Go's runtime which eats our precious resources?
Possibly, but what can it be? Maybe cgo? We don't use it. How about our dependencies? We checked and indeed we had 4 dependencies with cgo. However, 2 dependencies out of 4 were from stdlib (unlikely they're guilty), the 3rd had a cgo indirect dependency but didn't use the entities with cgo from there. And the last dependency had cgo enabled only for
GOOS="darwin". But to make sure we're not missing anything we rebuilt the binary of one of the services withCGO_ENABLED=0and it didn't help. (Un)fortunately, it wasn't cgo.What if we do an U-shape turn of our thoughts and come from another side. What if go's profiler says the truth?
After some browsering we found one prominent issue, albeit old and resolved one:
A short recap of how RAM works from the OS's point of view. When a process requests some bytes, OS instead of giving the exact amount of memory gives a page of a fixed size (the exact number depends on the OS and the hardware setup, and usually ranges between
4-16KiB) and assigns it to the process. This optimises memory access and speeds up allocations (you don't need to request memory for every 4 bytes you need), but in the same time it's ineffective from the memory utilisation perspective (do NOT search for how much memory is wasted due to fragmentation. You're gonna be upset. I warned ya).Now, there are 2 kinds of memory metrics in profiler: allocs and heap. Heap is a snapshot of the current memory usage and as we already know it's less than 10MiB. Allocs is essentially the same, but cumulative. Allocs grows quite fast, because runtime constantly allocates/frees memory in huge amounts (~3+GiB at the time when we hit our 2GiB pods limit) and it's a non-trivial task to tell whether the value is abnormal or not. So we thought, okay, GC frees memory, but what if the pages for some reason are not claimed back by the OS.
Go's GC uses a variation of mark&sweep collector, which does Stop The World™, marks unreachable variables as to-be-cleaned, and on the next phase marks freed pages as ~prepared~, meaning they're available for new allocations. As you can see there's no 'return to os, what is rightfully its' stage. What happens in reality is os checks if there are available for claiming back pages - ~prepared~ and if there are, then it collects them, and now memory is truly freed. But if there's no memory pressure in OS, then sometimes it is reluctant to reclaim them. And what a surprise, on the node, on which our namespace was hosted, total RAM usage was less than 5%!
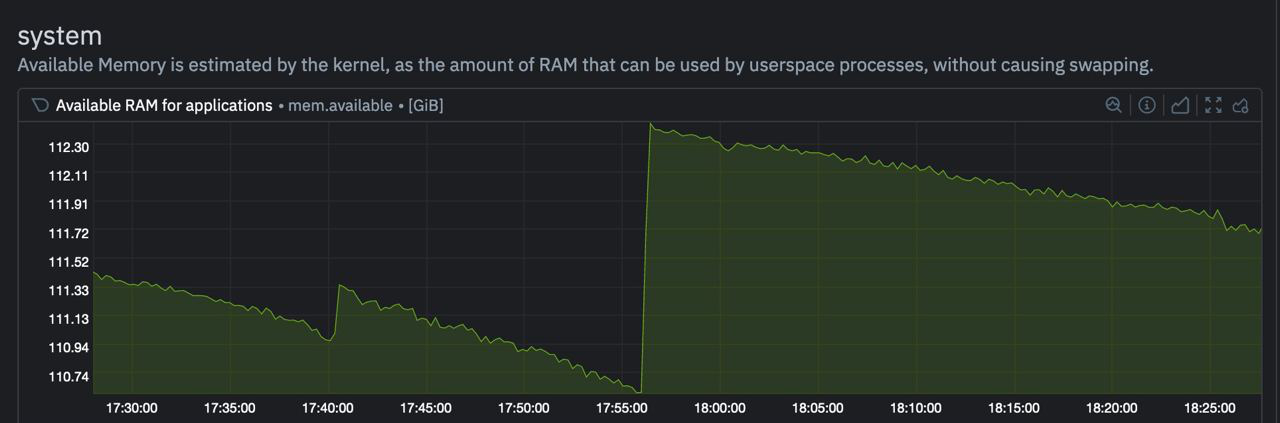
But how can we test the no-mem-pressure theory? Correct, spin up a service on a small node and see what happens. Well, we did it and realised several things:
- Our testing and staging had much less resourses, but we could still reproduce the leak on them even if we put them under requests pressure.
- To reproduce the leak we had to put a decent amount of load on the service. Otherwise, no load - no leakage. (That's why we discovered it only when migrated to production).
We deployed an arbitrary service on our old GCP cluster to double-check and it was working just fine, no memory leaks. So:
- our services indeed consumed a couple of megs at any point of time, but the process over several gigs.
- a process consumed all the available memory eventually.
- putting a node under pressure had not effect
- it's not cgo, but we didn't rule out it completely as the go's profiler showed low memory consumption.
Nevertheless, it was the dead end, and we had to start from the beginning.
We kept looking for clues, messing with services and infra and found out something interesting. The old image version (~10 versions ago) of one service had no leak. We quickly unsheathed our git bisects and started narrowing it down. But what we narrowed it down to is that the only version leaking memory was the latest one.
What? No sense at all. Totally.
And that my dear friends was the moment when the God decided that enough of this spectacular performance, he came down from heaven to one SRE guy and gave him the brightest thought.
Migrating to AWS we also rounded some corners and decided that why we need to build both testing and production images when we can have only one? Less hustle - more free space. Now, every time we triggered a deploy to testing, an image was built and uploaded to the hub. After we tested the feat and decided that it's time to deploy it to prod, we don't build an image anew, and use the testing one. Our images for testing and prod should absolutely identical, but one tiny line made them differ:
RUN go build $(case "$ENV" in (local|testing) echo "-race ";; esac) -o cli ./cmd/service
OMG!! And now the Universe converged, no wonder we were allocating that much recources, the race detector is a well-known memory abuser! We checked for issues and here we go:
Their Majesty The Culprit: https://github.com/golang/go/issues/37233..

A bug review: 2/10 🥰
We could totally feel this guy. Turns the race detector is not just a memory abuser, it's a bottomless pit, a black hole absorbing everything around it.
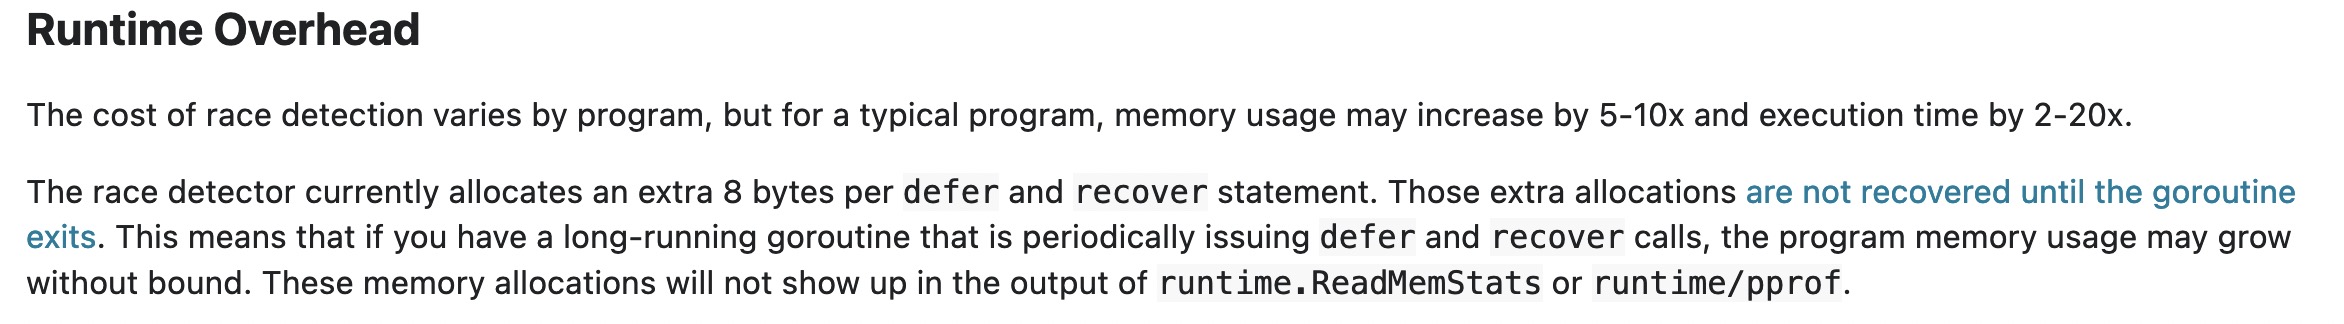
Small comment at the bottom of the race detector guide. It was added there after the bug was discovered.
The motivation of having race detector enabled for testing env is dubious, but it was in the Dockerfile long before any of us was in the company and we had no strong objections why it shouldn't be enabled before. We removed the -race flag from the build and lived happily ever after till new offers and layoffs did us part.
Conclusions:
- Know your tools.
- Know the tools for monitoring your tools.
- See 1.